MySQL Wait Event Analyses Details
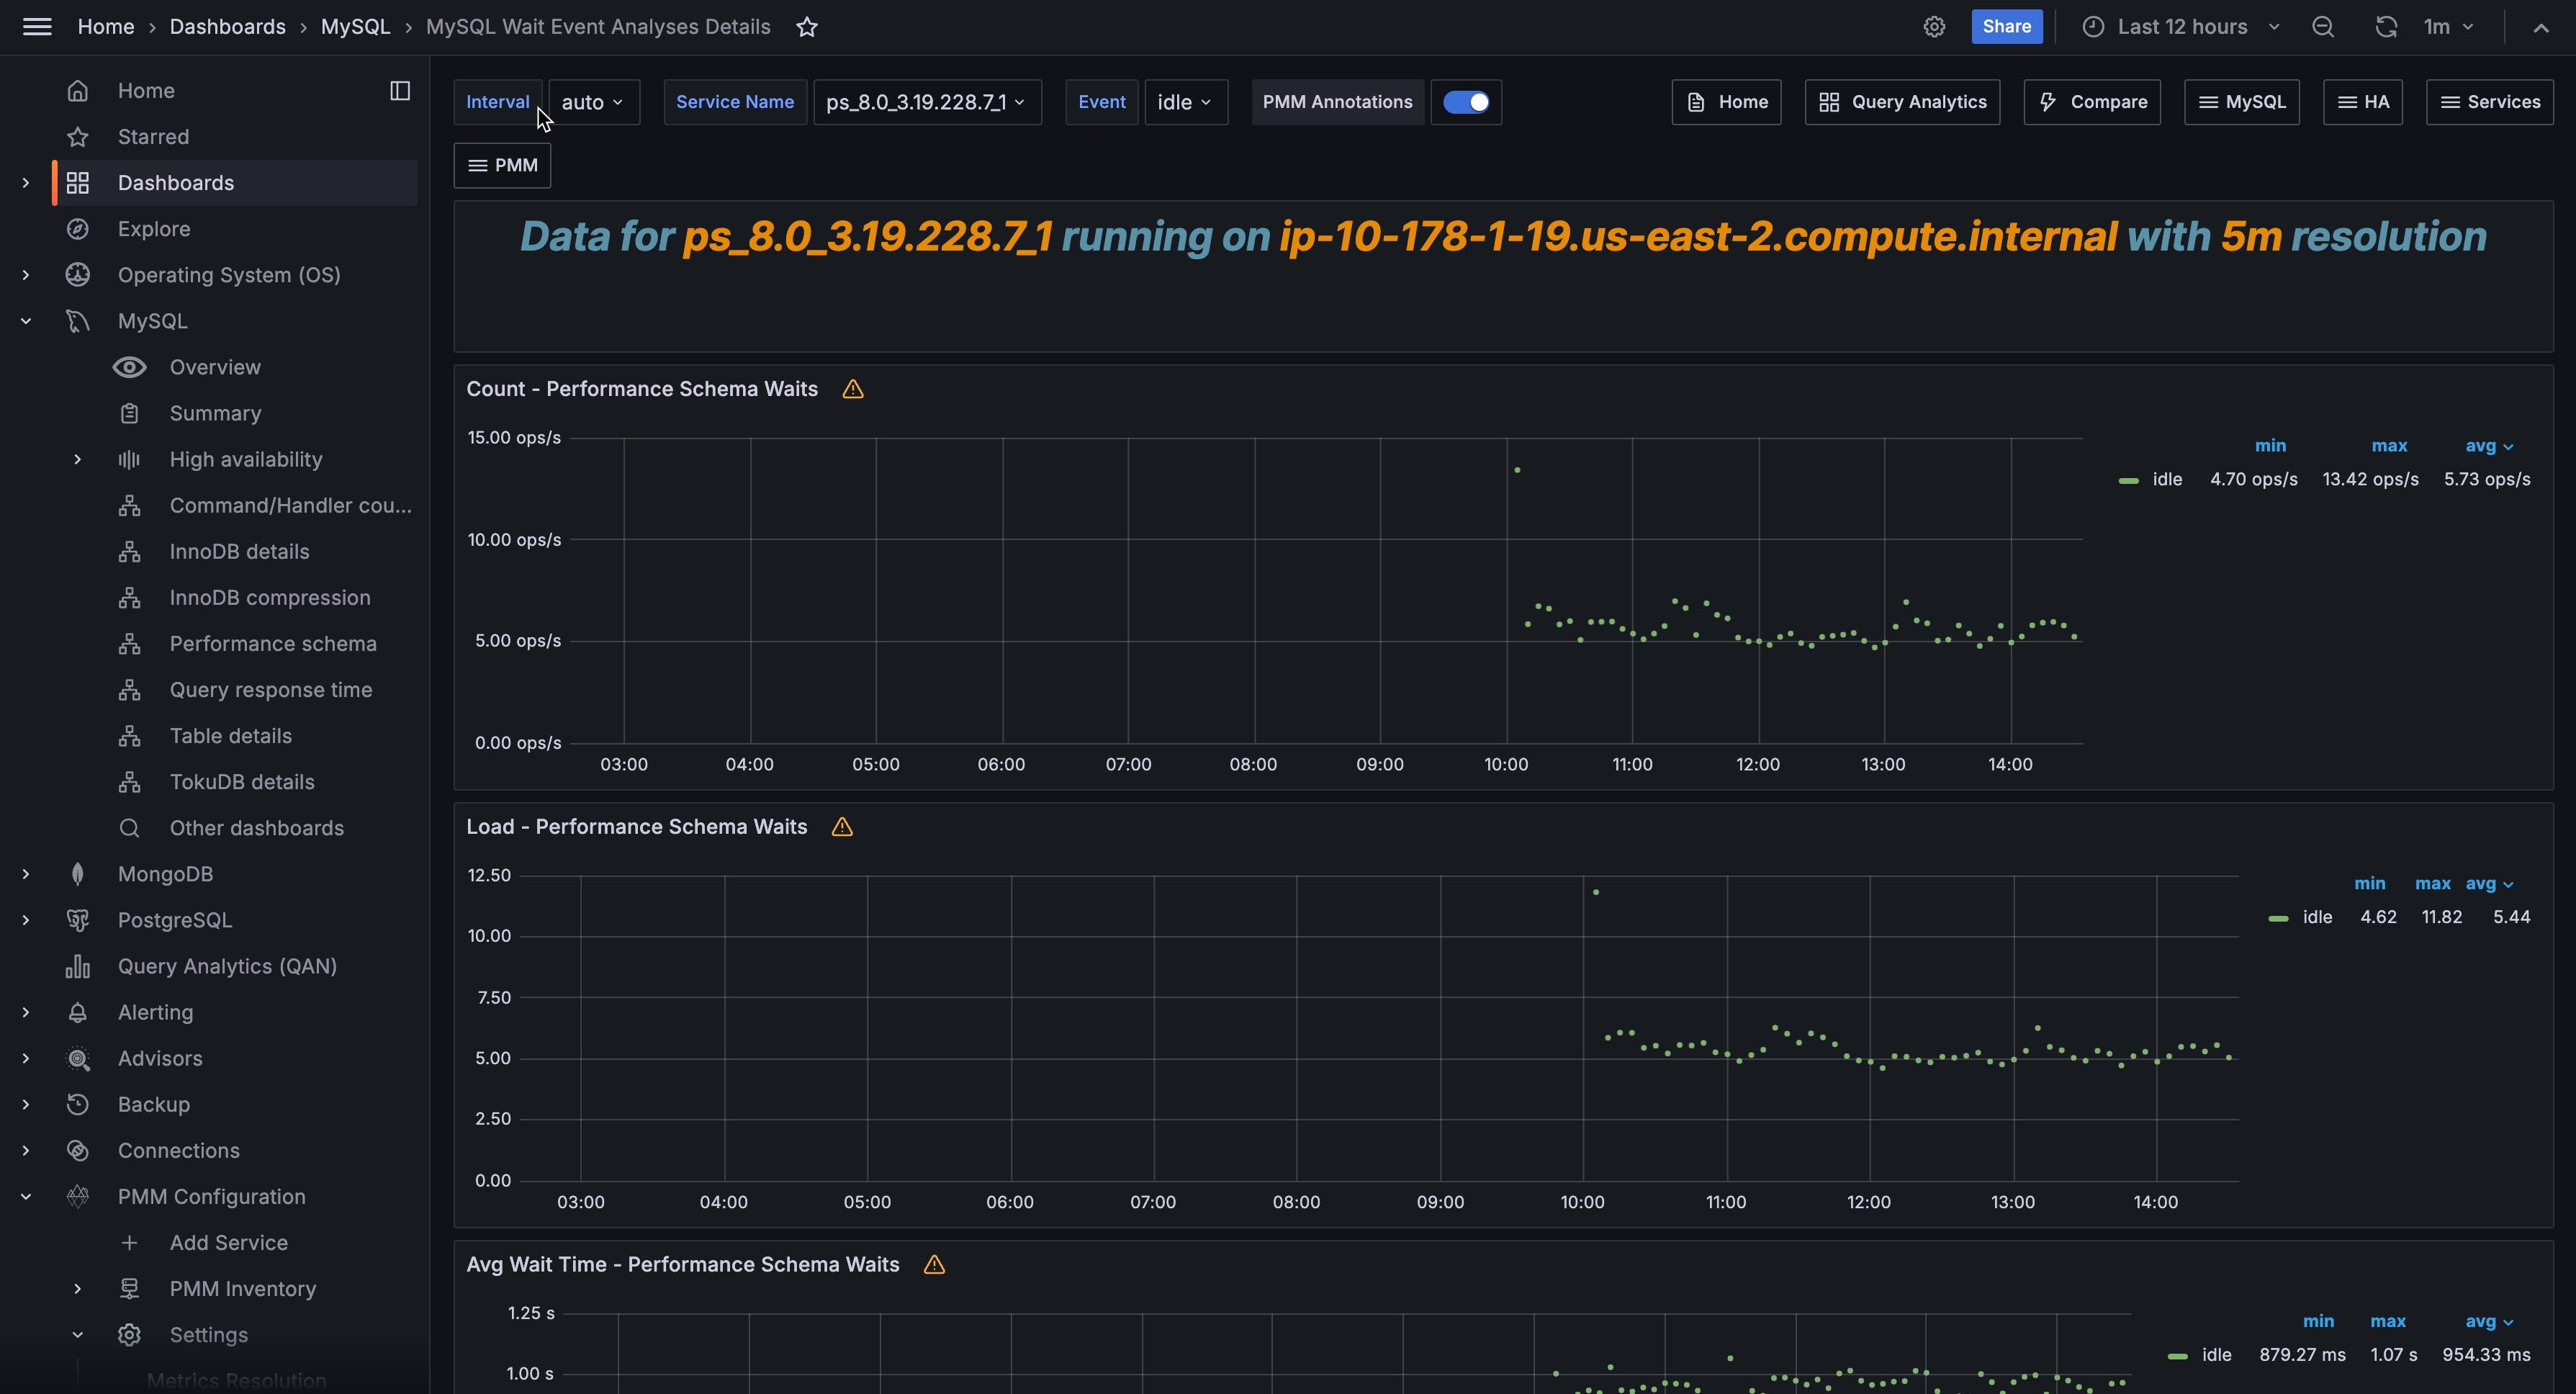
This dashboard helps to analyze Performance Schema wait events. It plots the following metrics for the chosen (one or more) wait events:
- Count - Performance Schema Waits
- Load - Performance Schema Waits
- Avg Wait Time - Performance Schema Waits
Get expert help
If you need assistance, you can find comprehensive and free database knowledge on our community forum or blog posts. For professional support and services, contact our Percona Database Experts.