Connect an external instance
Add general external services
You can collect metrics from an external (custom) exporter on a node when:
- there is already a pmm-agent instance running and,
- this node has been configured using the
pmm-admin configcommand.
Usage
pmm-admin add external --service-name=<service-name> --listen-port=<listen-port> --metrics-path=<metrics-path> --scheme=<scheme>
pmm-admin add external-serverless --external-name=<external-service-name> --host=<hostname> --listen-port=<listen-port> --metrics-path=<metrics-path> --scheme=<scheme>
Get data from external exporters
There two ways to get metrics from other exporters:
-
externalwill collect metrics from the exporter that is run on the same host as PMM Client’s connection to it by a port. (See more details withpmm-admin add external --help.) -
external-serverlessis useful for collecting metrics from cloud services. You need a host and port number to add it to PMM Server. (See more details withpmm-admin add external-serverless --help.)
Here are the differences between external and external-serverless types.
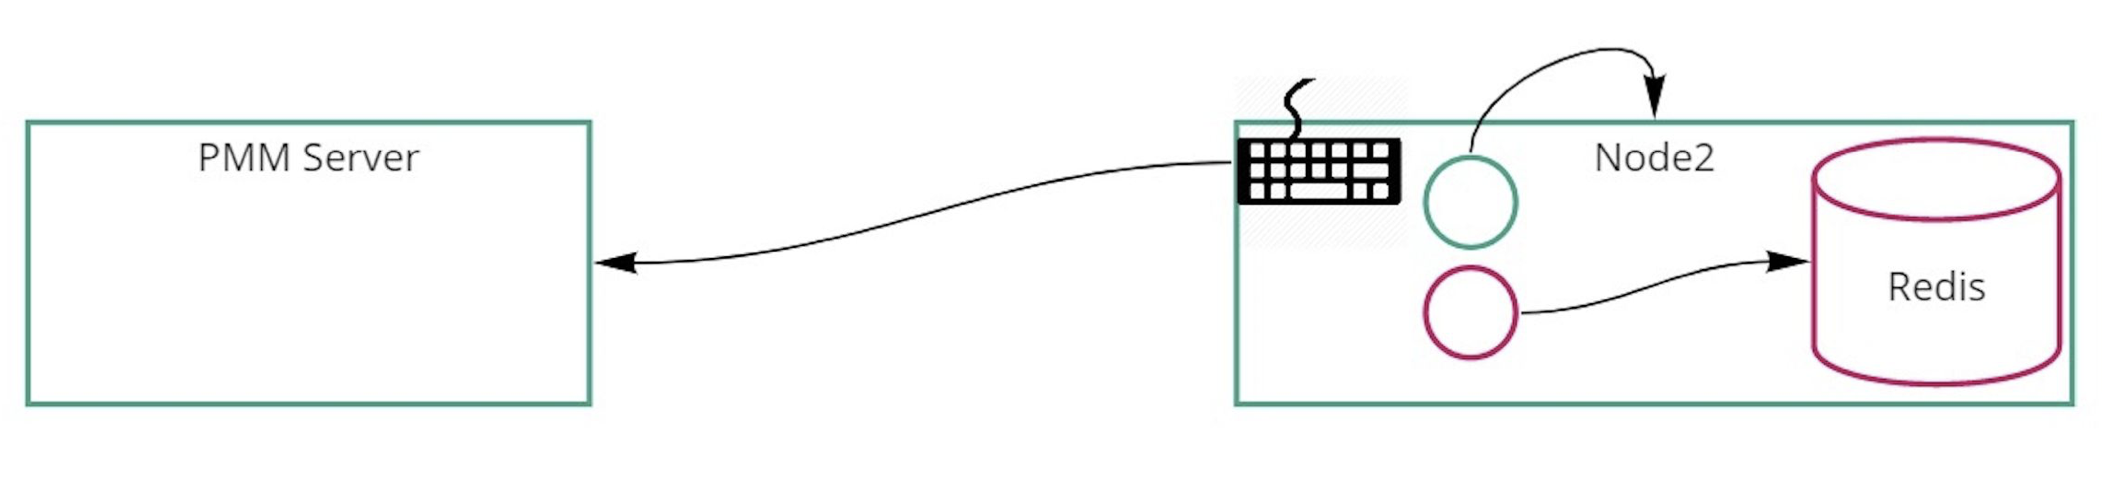
Connection schema of external exporter:
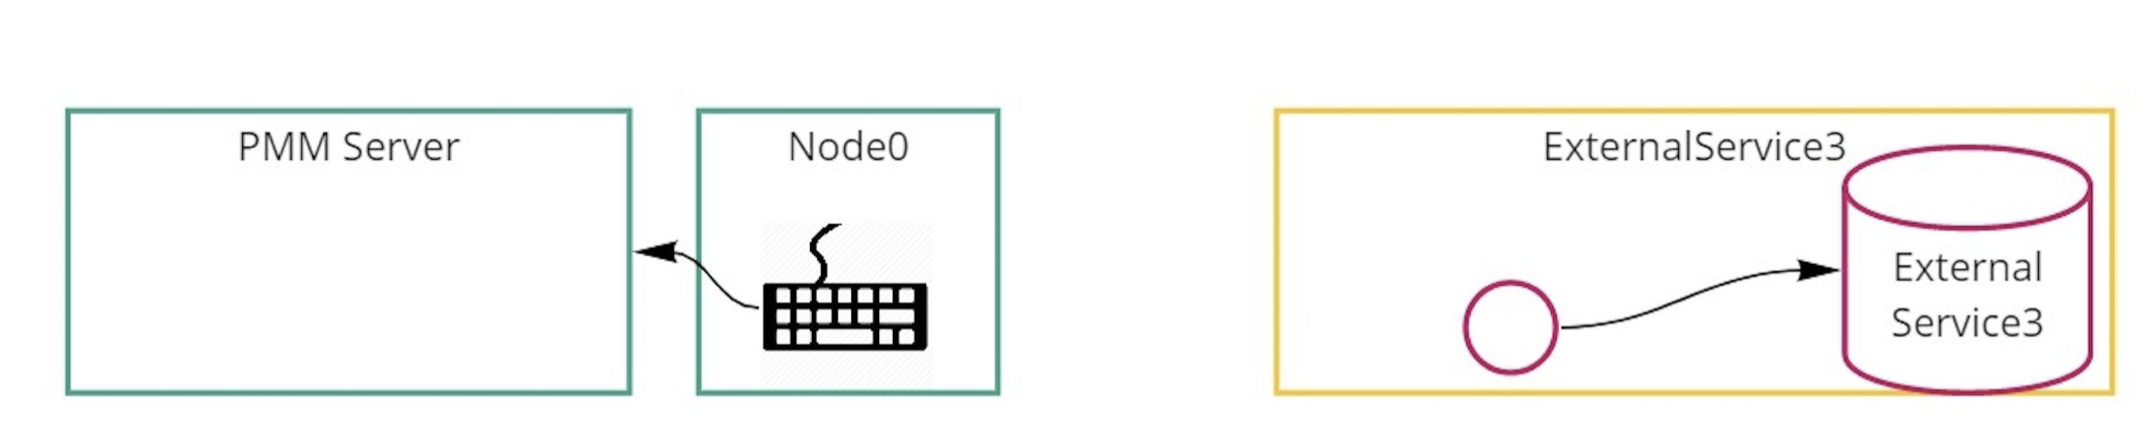
Connection schema of external serverless exporter:
Add a service not supported by PMM
PMM can collect any metrics in Open metrics or Prometheus exposition format. You must specify the host and port of these metrics using the pmm-admin add external or pmm-admin add external-serverless commands.
From this point, PMM will collect and store available metrics.
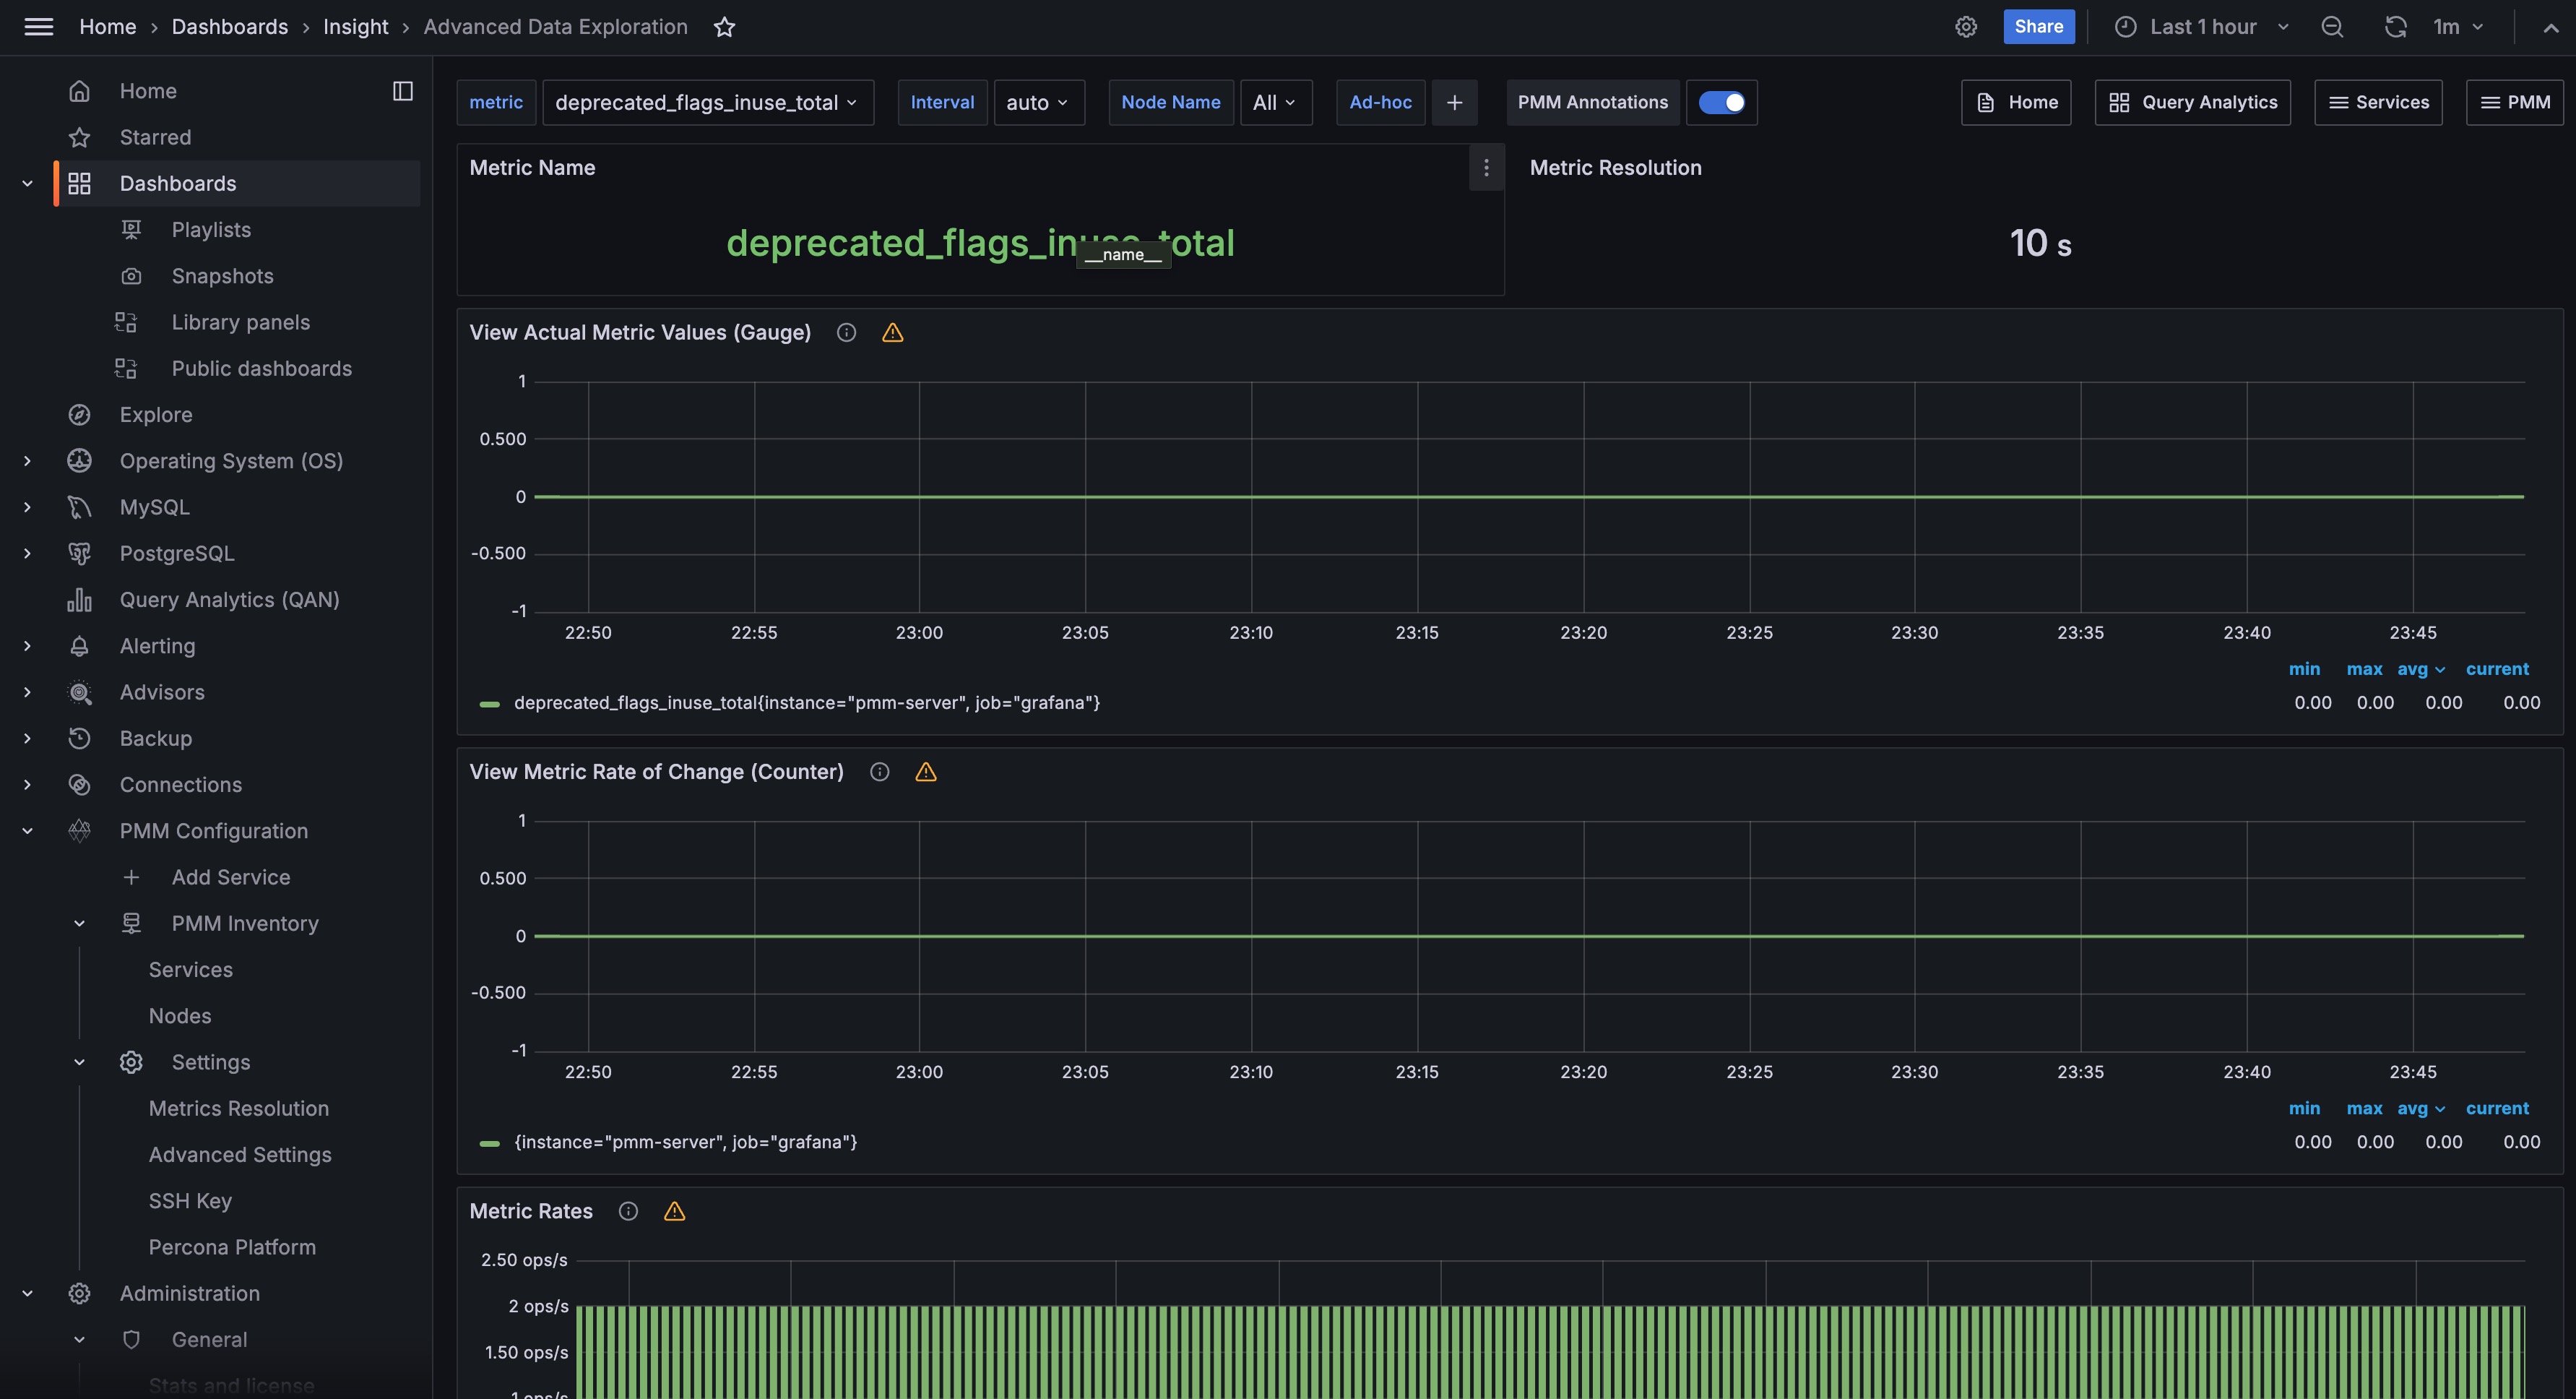
To browse and visualize collected metrics as a first step, we can look at the Advanced Data Exploration dashboard and select informative services and metrics.
Another way is to create a new Grafana Dashboard to PMM as needed.
One more way is to search for an already created dashboard at https://grafana.com/grafana/dashboards for the added exporter and import it into PMM.
Third-party exporters
You can find more exporters on the official Prometheus page.
Custom exporter
You can write a custom external exporter or extend your application to expose metrics in Prometheus format.
For more details see https://prometheus.io/docs/instrumenting/writing_exporters/.
Example
root@mysql1:~# pmm-admin add external --group=processes  --listen-port=9256
External Service added.
Service ID  : 6485f4fd-745b-4dfb-8b72-328e300f8b50
Service name: mysql1-processes
Group       : processes
- Add an exporter running on local port 9256 to the group called
processes. - Use the group and host names to automatically generate a service name.
- Use the default scheme and metrics path.
Add an external service via UI
To add an external service via PMM UI:
-
In the PMM web interface, go to Configuration → PMM Inventory → Add Instance.
-
Select External Service – Add a remote instance.
-
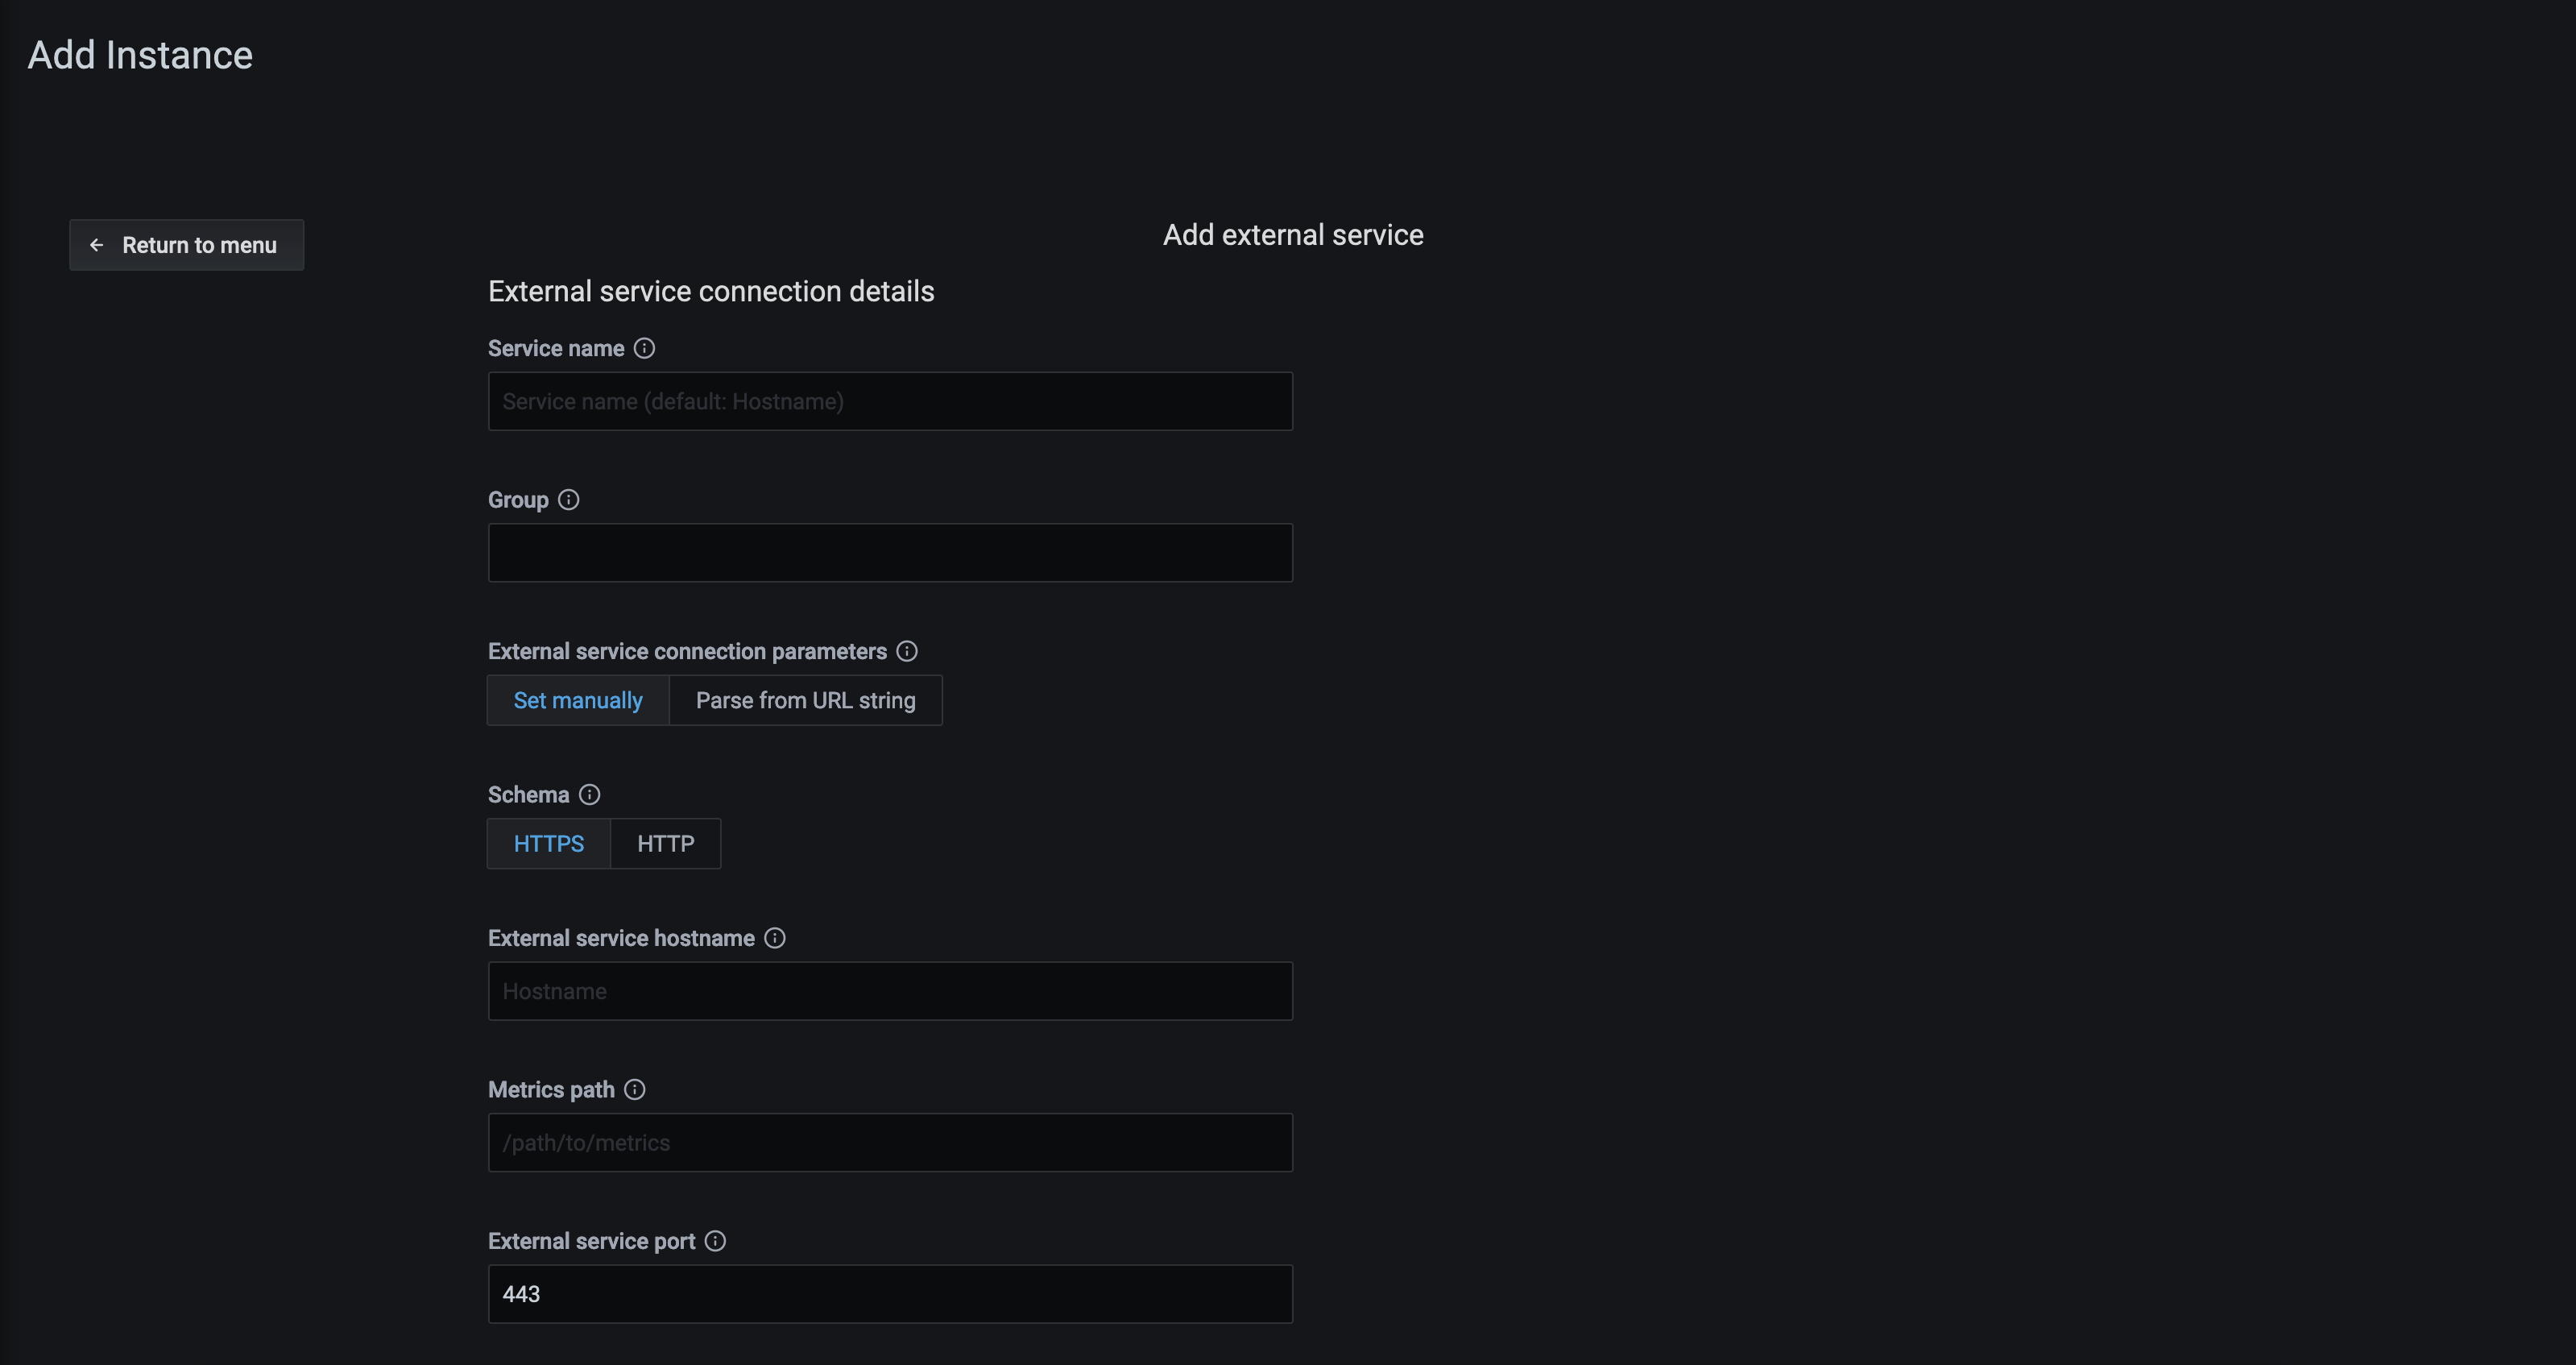
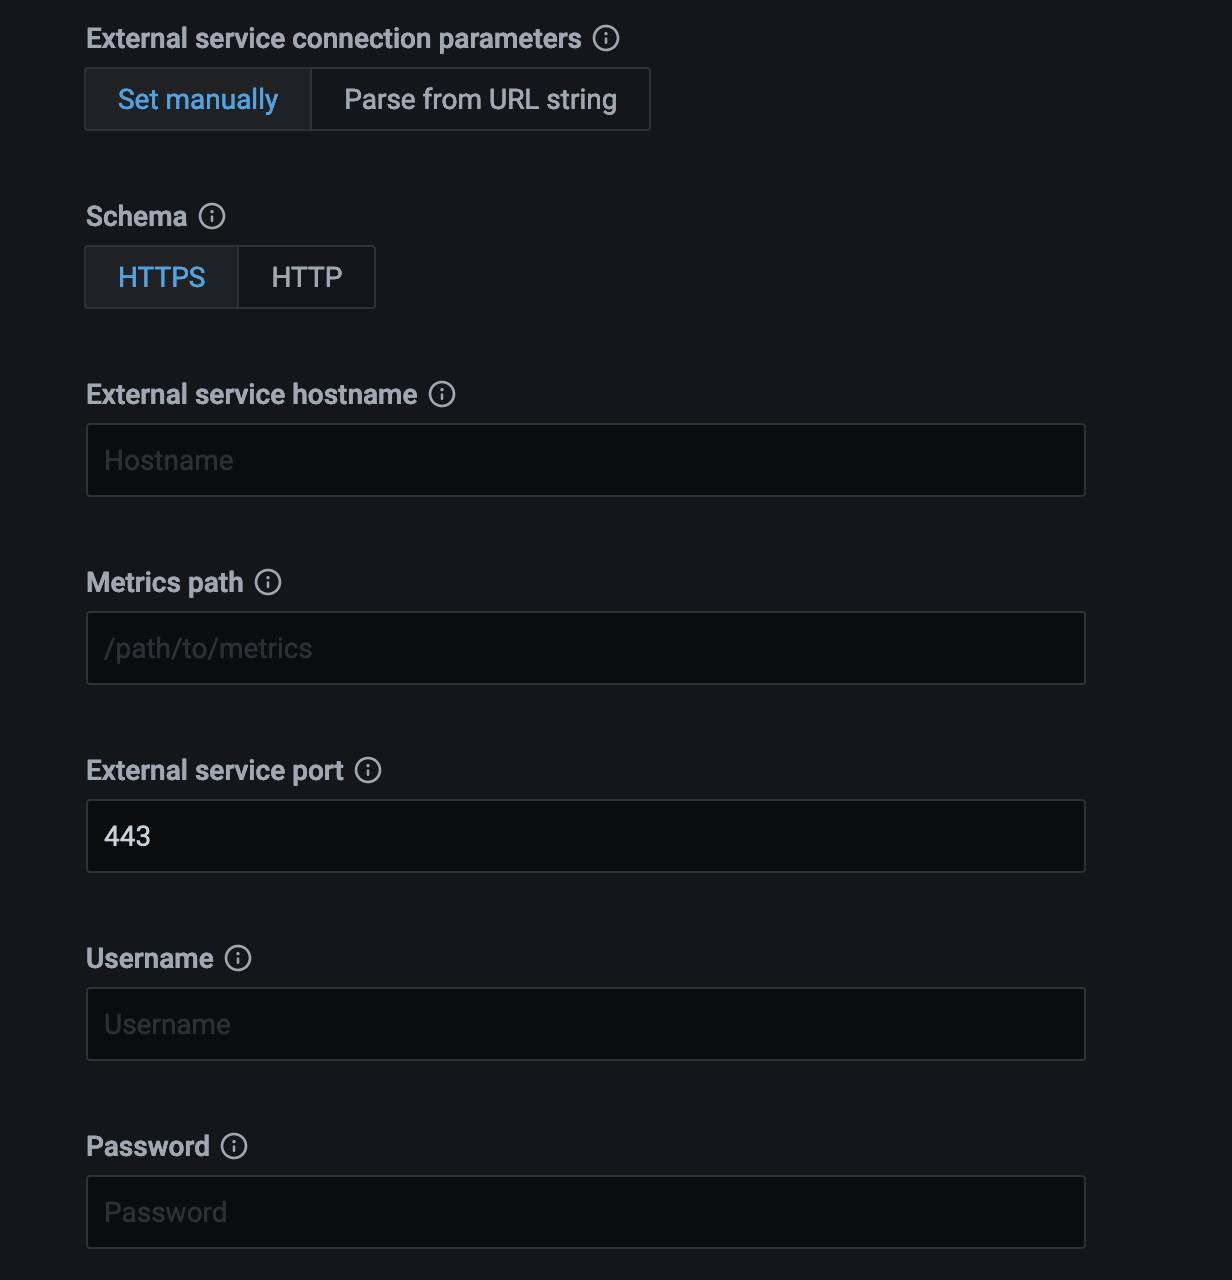
Fill the form and set the external service endpoint.
The endpoint can be set manually:
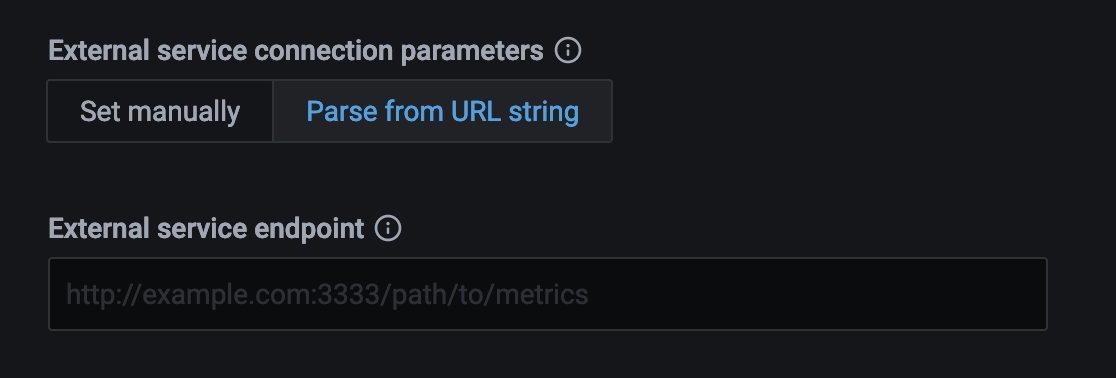
or by parsing required data from a URL string, in which case you only need to pass a valid URL.
Get expert help
If you need assistance, you can find comprehensive and free database knowledge on our community forum or blog posts. For professional support and services, contact our Percona Database Experts.