Experimental MongoDB Oplog Details
Disclaimer
This is an Experimental Dashboard that is not part of the official Percona Monitoring and Management (PMM) deployment and might be updated. We ship this Dashboard to obtain feedback from our users.
Availability
This experimental dashboard is available starting with PMM 2.30.0.
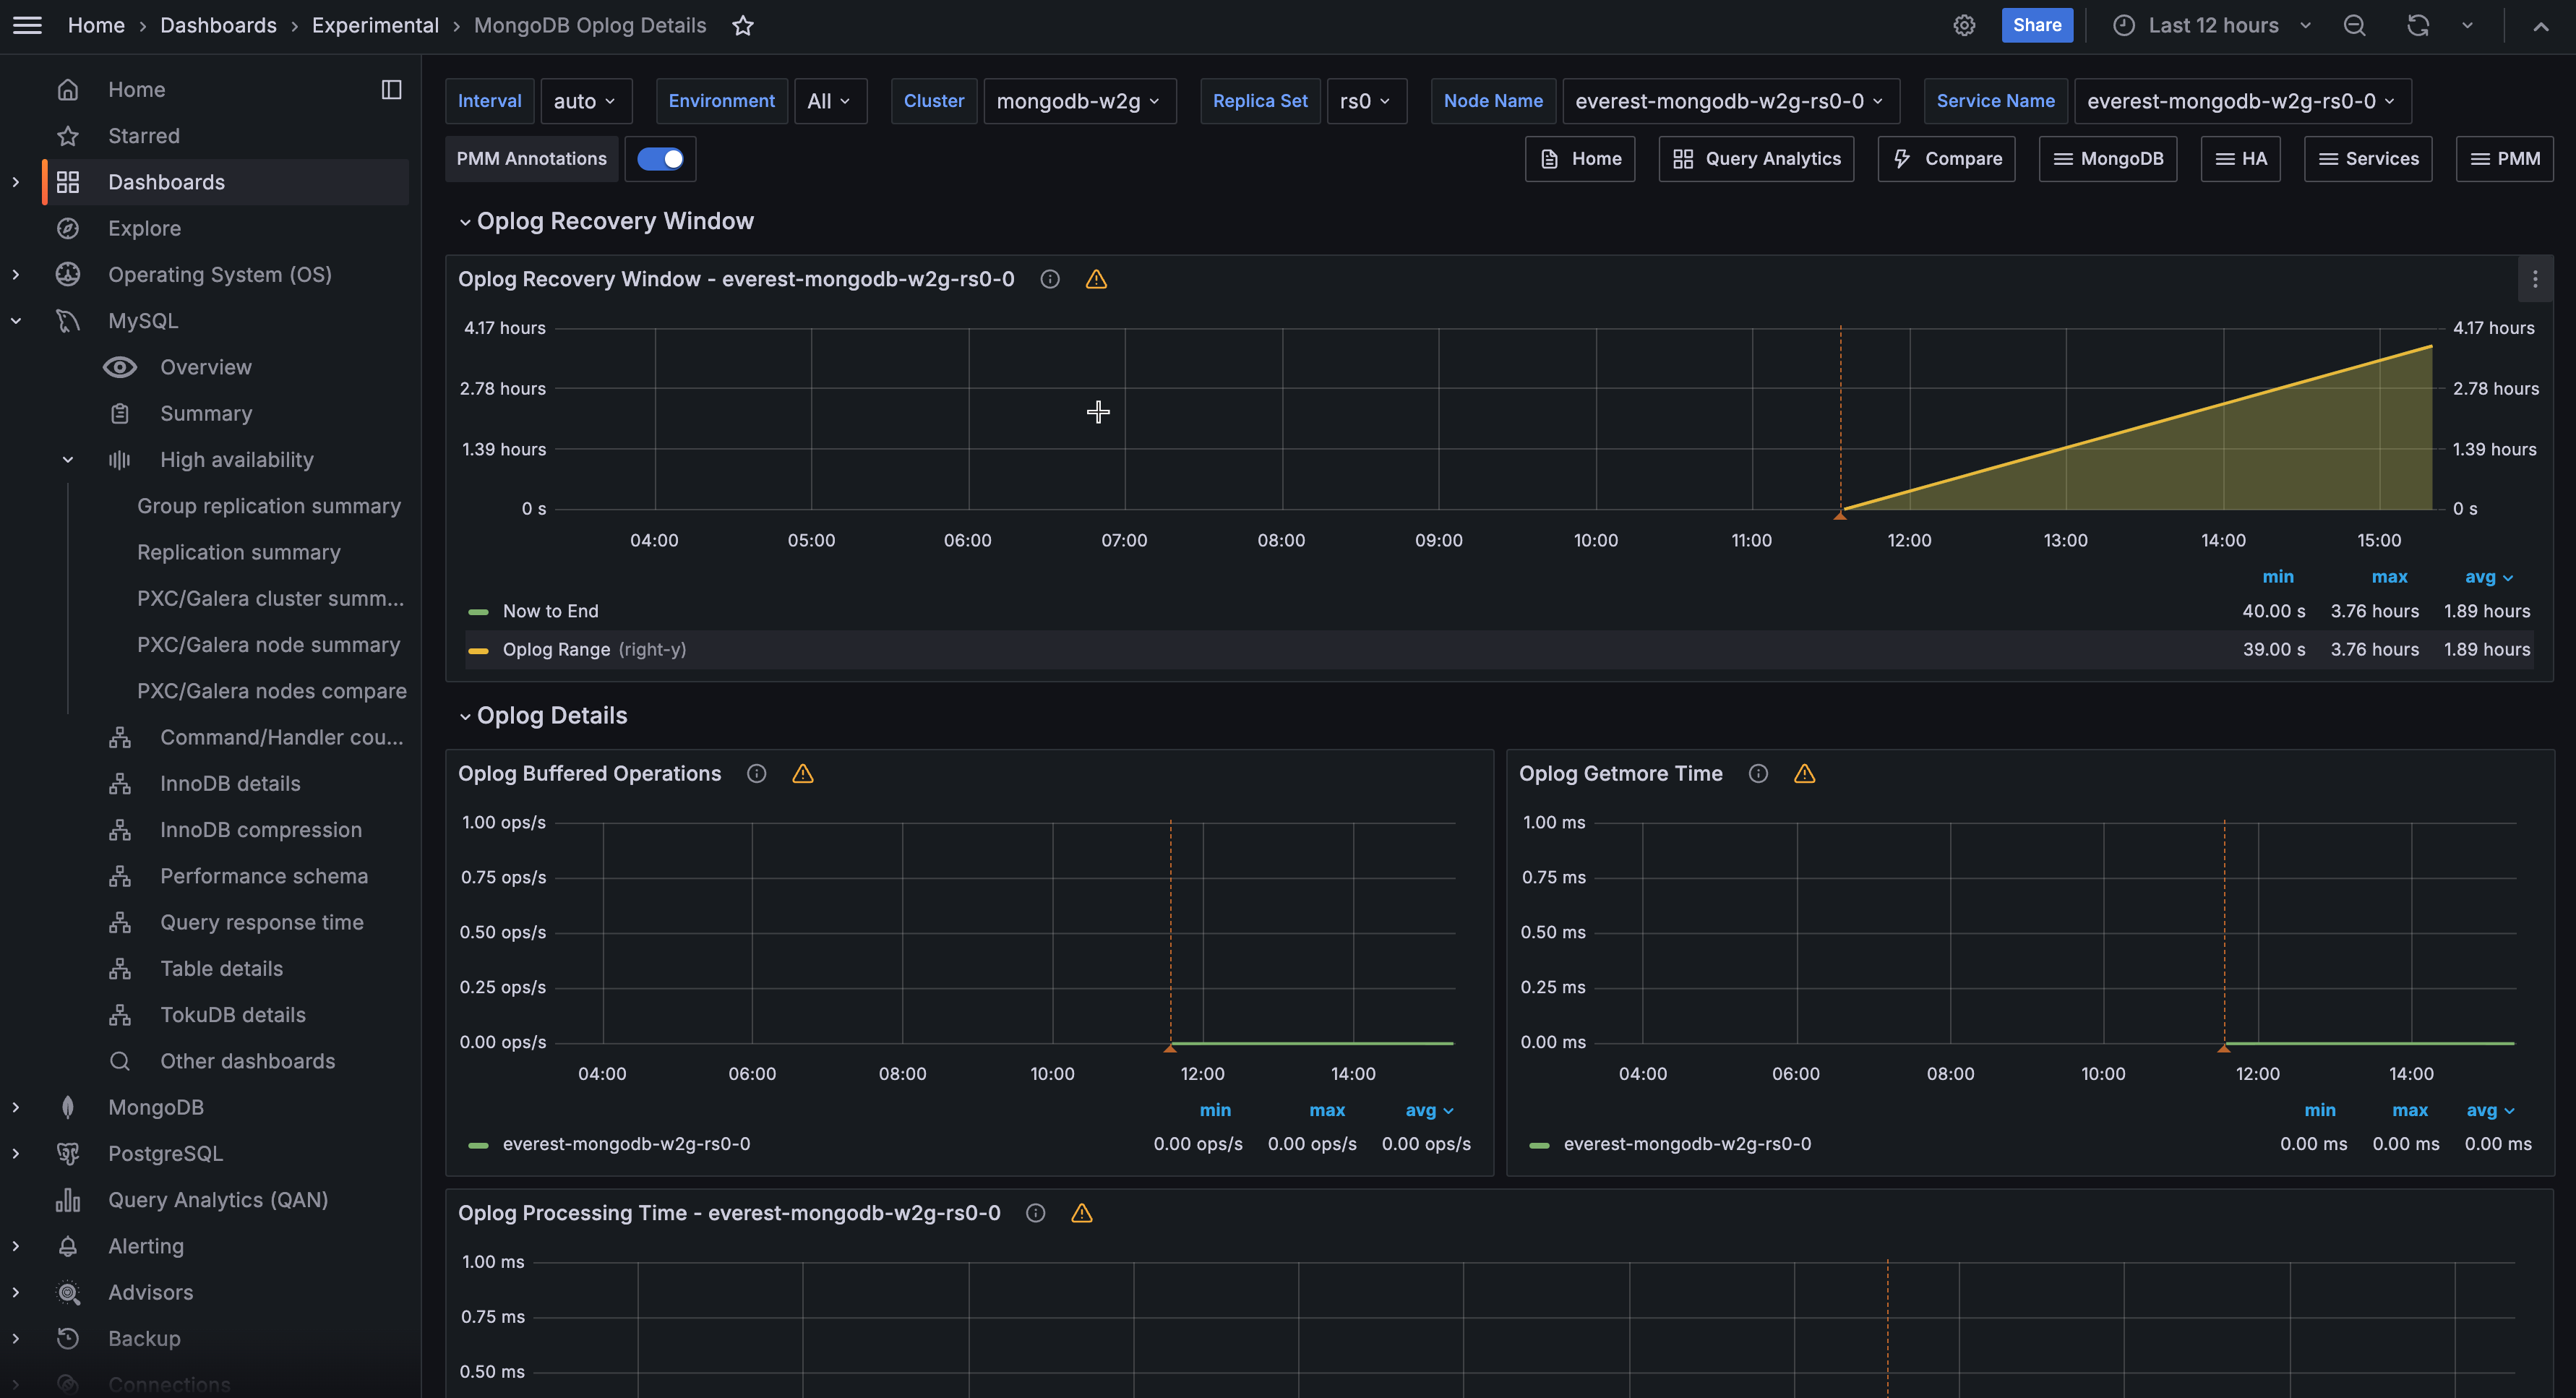
This realtime dashboard contains Oplog details such as Recovery Window, Processing Time, Buffer Capacity, and Oplog Operations.
Get expert help
If you need assistance, you can find comprehensive and free database knowledge on our community forum or blog posts. For professional support and services, contact our Percona Database Experts.